Tusd failing on large file upload

I’m running tusd in a Docker container in Azure, and using Uppy to send files to it.

Small files work great.

But large files seem to cause tusd to use a large amount of memory, and then crash:

The behavior that the client sees is a very long lived request to upload the file, the % upload complete will stall out around 50-70% through, and the tusd service returns a 500.

The file is 221MB that I am attempting to upload. From what I can tell, it seems like tusd is building the file up in memory, instead of streaming it to Azure Storage.

This is what my Dockerfile looks like:

FROM tusproject/tusd:v2.0

ARG AZURE_STORAGE_ACCOUNT
ARG AZURE_STORAGE_KEY

ENV AZURE_STORAGE_ACCOUNT=${AZURE_STORAGE_ACCOUNT}
ENV AZURE_STORAGE_KEY=${AZURE_STORAGE_KEY}

I’m currently running it on an Azure App Service set to Standard S1 size, which means 1.75GB of memory.

My tusd options are:

--azure-storage uploads --azure-endpoint https://****.blob.core.windows.net --hooks-http https://***.azurewebsites.net/api/app/upload/webhook --hooks-http-forward-headers Authorization --hooks-enabled-events pre-create,pre-finish --cors-expose-headers X-Upload-Properties-Set,X-Upload-File-Path --behind-proxy

I’m having trouble figuring out how to view the tusd logs, so I do not have those yet, apologies.

Well, my everything appears to be working for me, and large files are successfully uploading.

However, this memory profile is worrying:

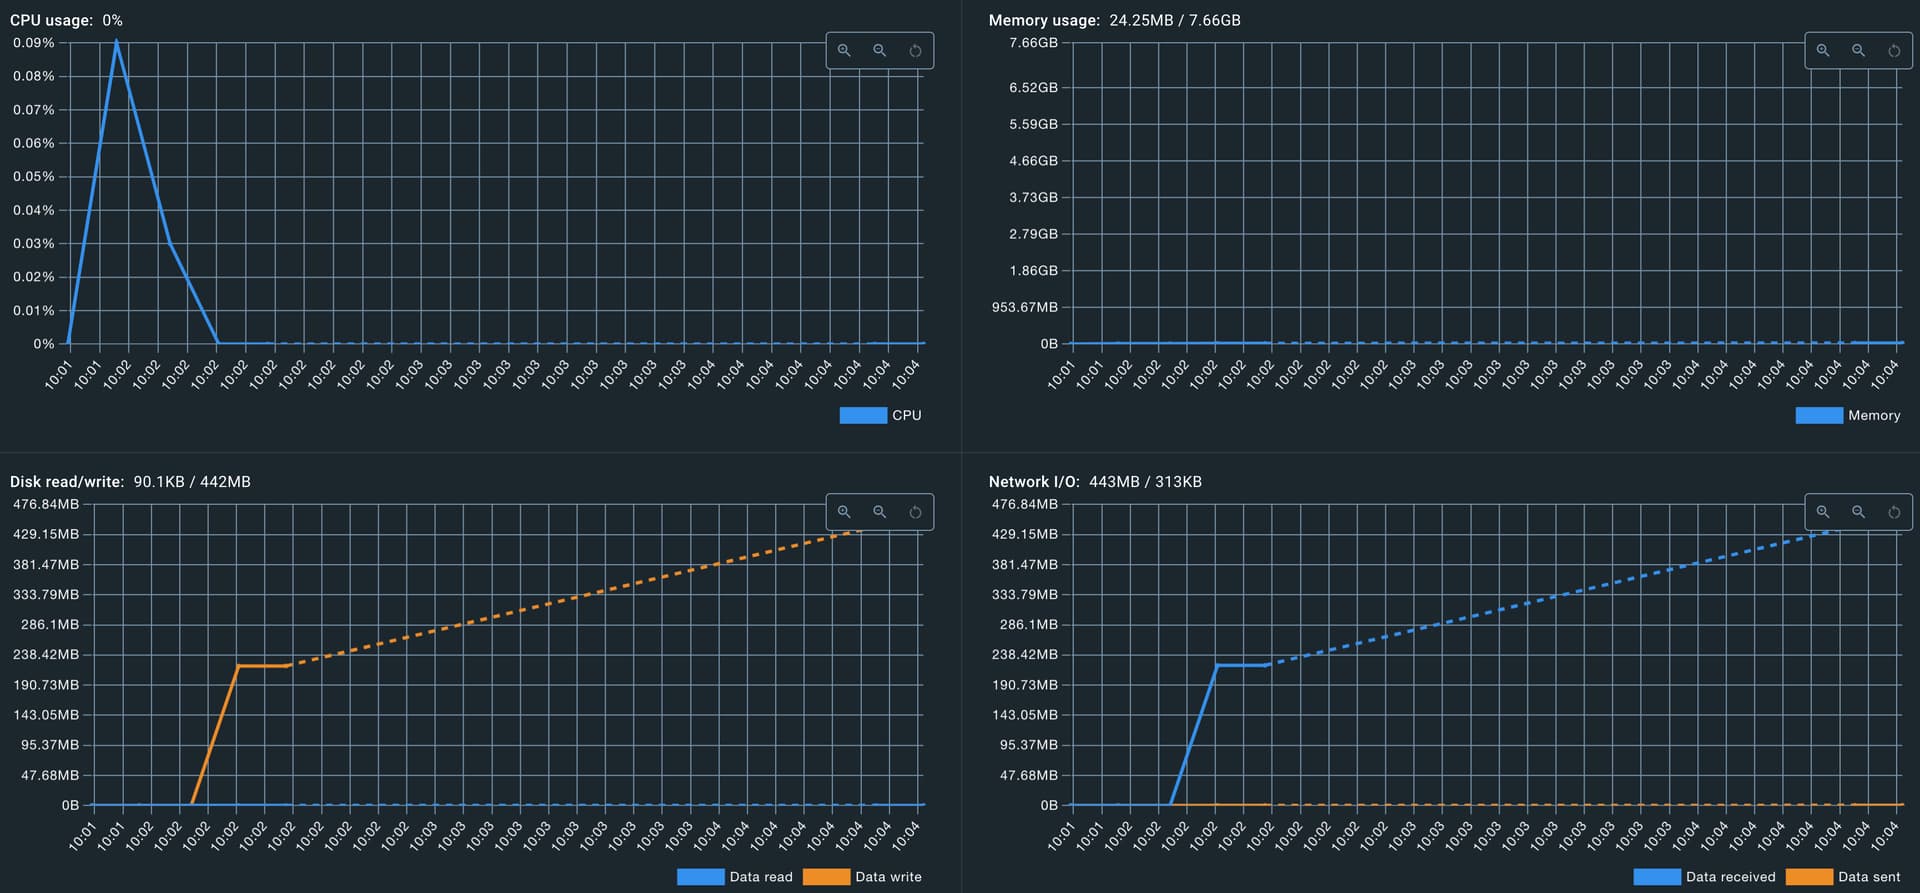
I uploaded a single 221MB file, and the memory usage spiked up to 320MB during the upload. Is this expected for Azure uploads? What if multiple uploads are happening at the same time?

Here is the tusd log of a successful upload:

2023-11-05T17:34:59.984862677Z 2023/11/05 17:34:59.981208 level=INFO event=RequestIncoming method=POST path="" requestId=""
2023-11-05T17:34:59.995314183Z 2023/11/05 17:34:59.995228 level=DEBUG event=HookInvocationStart type=pre-create id=""
2023-11-05T17:35:00.220254364Z 2023/11/05 17:35:00.219909 level=DEBUG event=HookInvocationFinish type=pre-create id=""
2023-11-05T17:35:00.293858303Z 2023/11/05 17:35:00.291486 level=INFO event=UploadCreated method=POST path="" requestId="" id=wcmSotbaEVQ-filename.zip id=wcmSotbaEVQ-filename.zip size=221110053 url=https://AZUREACCOUNT.azurewebsites.net/files/wcmSotbaEVQ-filename.zip
2023-11-05T17:35:00.293903703Z 2023/11/05 17:35:00.291619 level=INFO event=ResponseOutgoing method=POST path="" requestId="" id=wcmSotbaEVQ-filename.zip status=200 body=""
2023-11-05T17:35:00.338099206Z 2023/11/05 17:35:00.337054 level=INFO event=RequestIncoming method=OPTIONS path=wcmSotbaEVQ-filename.zip requestId=""
2023-11-05T17:35:00.338140106Z 2023/11/05 17:35:00.337210 level=INFO event=ResponseOutgoing method=OPTIONS path=wcmSotbaEVQ-filename.zip requestId="" status=200 body=""
2023-11-05T17:35:00.370241518Z 2023/11/05 17:35:00.370117 level=INFO event=RequestIncoming method=PATCH path=wcmSotbaEVQ-filename.zip requestId=""
2023-11-05T17:35:00.399466955Z 2023/11/05 17:35:00.399262 level=INFO event=ChunkWriteStart method=PATCH path=wcmSotbaEVQ-filename.zip requestId="" id=wcmSotbaEVQ-filename.zip maxSize=221110053 offset=0
2023-11-05T17:36:36.846369568Z 2023/11/05 17:36:36.845415 level=INFO event=ChunkWriteComplete method=PATCH path=wcmSotbaEVQ-filename.zip requestId="" id=wcmSotbaEVQ-filename.zip bytesWritten=221110053
2023-11-05T17:36:36.890325406Z 2023/11/05 17:36:36.889518 level=DEBUG event=HookInvocationStart type=pre-finish id=wcmSotbaEVQ-filename.zip
2023-11-05T17:36:37.172473884Z 2023/11/05 17:36:37.172262 level=DEBUG event=HookInvocationFinish type=pre-finish id=wcmSotbaEVQ-filename.zip
2023-11-05T17:36:37.173408276Z 2023/11/05 17:36:37.172600 level=INFO event=UploadFinished method=PATCH path=wcmSotbaEVQ-filename.zip requestId="" id=wcmSotbaEVQ-filename.zip size=221110053
2023-11-05T17:36:37.175720957Z 2023/11/05 17:36:37.175636 level=INFO event=ResponseOutgoing method=PATCH path=wcmSotbaEVQ-filename.zip requestId="" id=wcmSotbaEVQ-filename.zip status=200 body=""

The memory usage is indeed troubling and not expected. We are not using the Azure storage in production, so I don’t have any operational experience with it.

Currently, our tusd servers use file-based storage directly and since deploying tusd v2 we see rare spikes of higher memory usage (“rare” means compared to the number of uploads these servers are handling):

This makes me wonder if this is a storage-independent issue. Could you try using the filestore and see if they same memory usage pattern appears as when using Azure? That would help tracking down the source of this.

I have confirmed, locally, that uploading to Azure storage uses a lot of memory, and that the file store does not.

Uploading to Azurite locally:

Uploading to File Store locally:

I’m working on getting a memory profile running on Azure

I can confirm that filestore on Azure does not experience the same high level of memory usage.

So this problem does seem to be related to the Azure Storage code.

Ok, thanks for the update. Can you open an issue in the tusd GitHub repository and potentially also include a heap dump (see Heap dump in Go using pprof. Learn how to extract dumps in Go using… | by Luan Figueredo | Medium), so we can see where the memory is held? You can enable profiling support in tusd using -expose-pprof (see https://github.com/tus/tusd/blob/1a43e26f16f43bed5dd2219c27e6eb14c125fb03/cmd/tusd/cli/flags.go#L174-L175).

I tried enabling -expose-pprof and see the following at /debug/pprof

/debug/pprof/
Set debug=1 as a query parameter to export in legacy text format


Types of profiles available:
Count	Profile
42	allocs
0	block
0	cmdline
14	goroutine
42	heap
0	mutex
0	profile
8	threadcreate
0	trace
full goroutine stack dump
Profile Descriptions:

allocs: A sampling of all past memory allocations
block: Stack traces that led to blocking on synchronization primitives
cmdline: The command line invocation of the current program
goroutine: Stack traces of all current goroutines. Use debug=2 as a query parameter to export in the same format as an unrecovered panic.
heap: A sampling of memory allocations of live objects. You can specify the gc GET parameter to run GC before taking the heap sample.
mutex: Stack traces of holders of contended mutexes
profile: CPU profile. You can specify the duration in the seconds GET parameter. After you get the profile file, use the go tool pprof command to investigate the profile.
threadcreate: Stack traces that led to the creation of new OS threads
trace: A trace of execution of the current program. You can specify the duration in the seconds GET parameter. After you get the trace file, use the go tool trace command to investigate the trace.

But all of the links on that page result in a 404, except for cmdline, profile, and trace.

I have created the github issue:

Please let me know if you need more information.

Seems like the heap path is not enabled here:

As described here:

I was able to get a heap dump and attach it into github

Any word on looking into this Azure Storage memory usage issue?

Thank you for opening the issue on GitHub. We will look into it this week.